Maps and Dataset Features
Maps and Dataset Features⚓︎
This section describes the group map, dataset map view, map controls, feature legend, and map-based feature details.
For a list of all guides on the TCAT Wiki, refer to the Guides List.
Group Map⚓︎
The Dataset Map on a project group page displays dataset boundaries. Each dataset card's Zoom To Dataset Boundary control selects its boundary and frames it in the map. Zoom in, Zoom out, and Reset bearing to north adjust the map view. The Draw rectangle control applies an area filter, and Clear selection removes that filter. The map instructions identify Escape as the way to exit drawing mode and describe keyboard access to map controls.
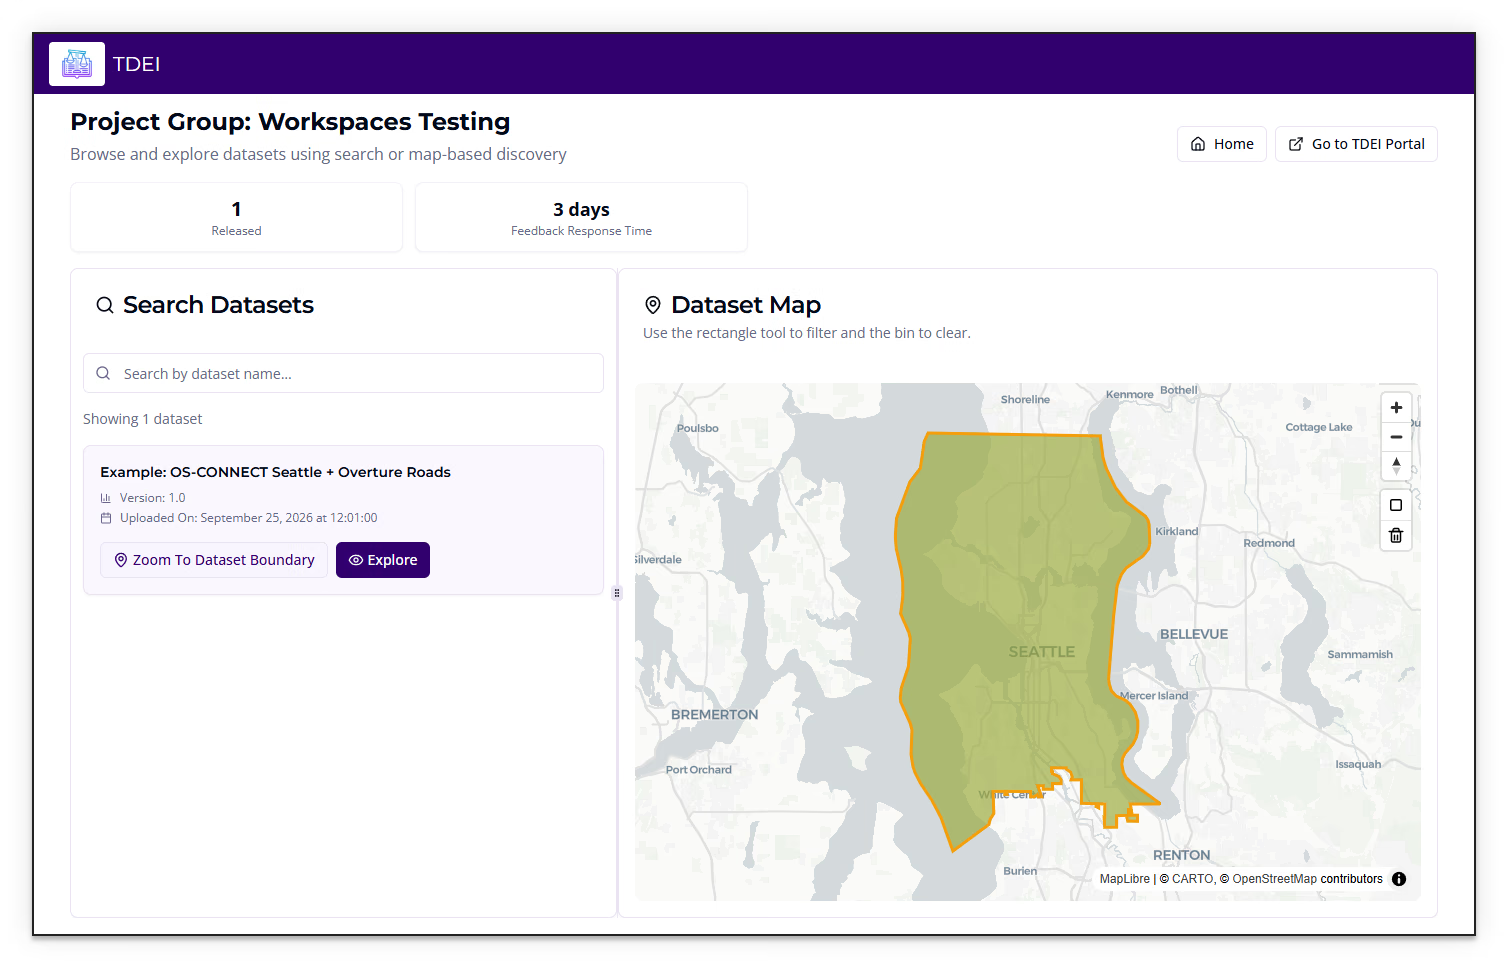
The separator between the dataset list and map is keyboard-resizable: when focused, Left Arrow and Right Arrow move the divider.
Dataset Map View⚓︎
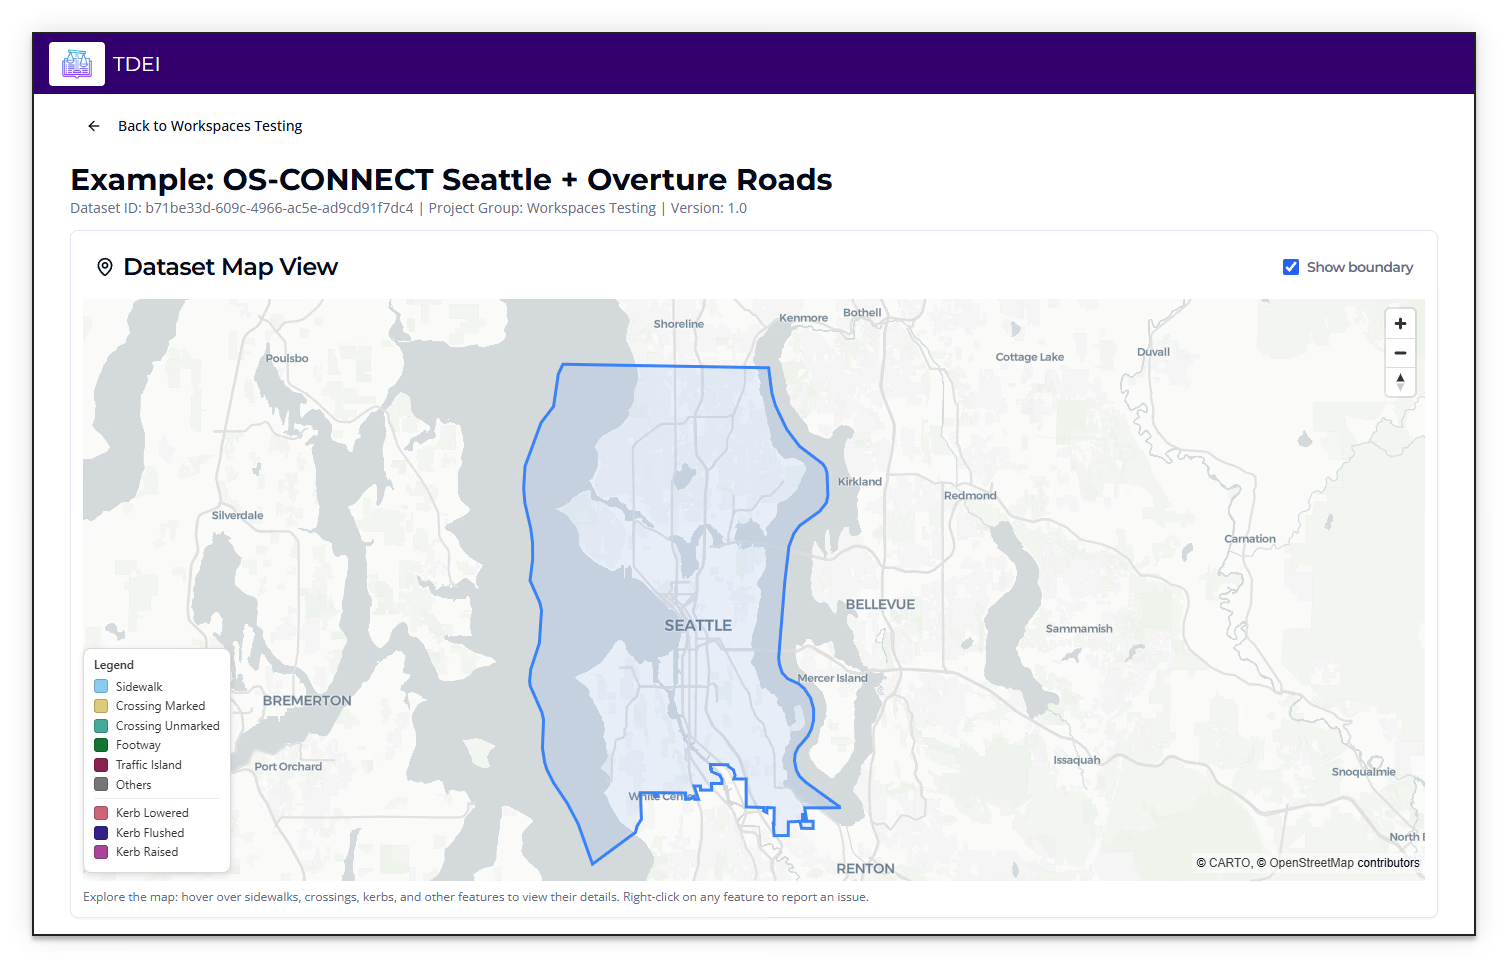
Selecting Explore on a dataset card opens the dataset-specific map. Its heading area displays the dataset name, dataset ID, project group, and version. The back control identifies the project group page it returns to. The Show boundary checkbox toggles the dataset boundary on the map.
The map includes Zoom in, Zoom out, and Reset bearing to north controls. Its legend identifies the feature categories displayed:
- Sidewalk
- Crossing Marked
- Crossing Unmarked
- Footway
- Traffic Island
- Others
- Kerb Lowered
- Kerb Flushed
- Kerb Raised
Feature Details on the Map⚓︎
Hovering over a mapped feature displays its available properties as key/value pairs. The properties depend on the selected feature.
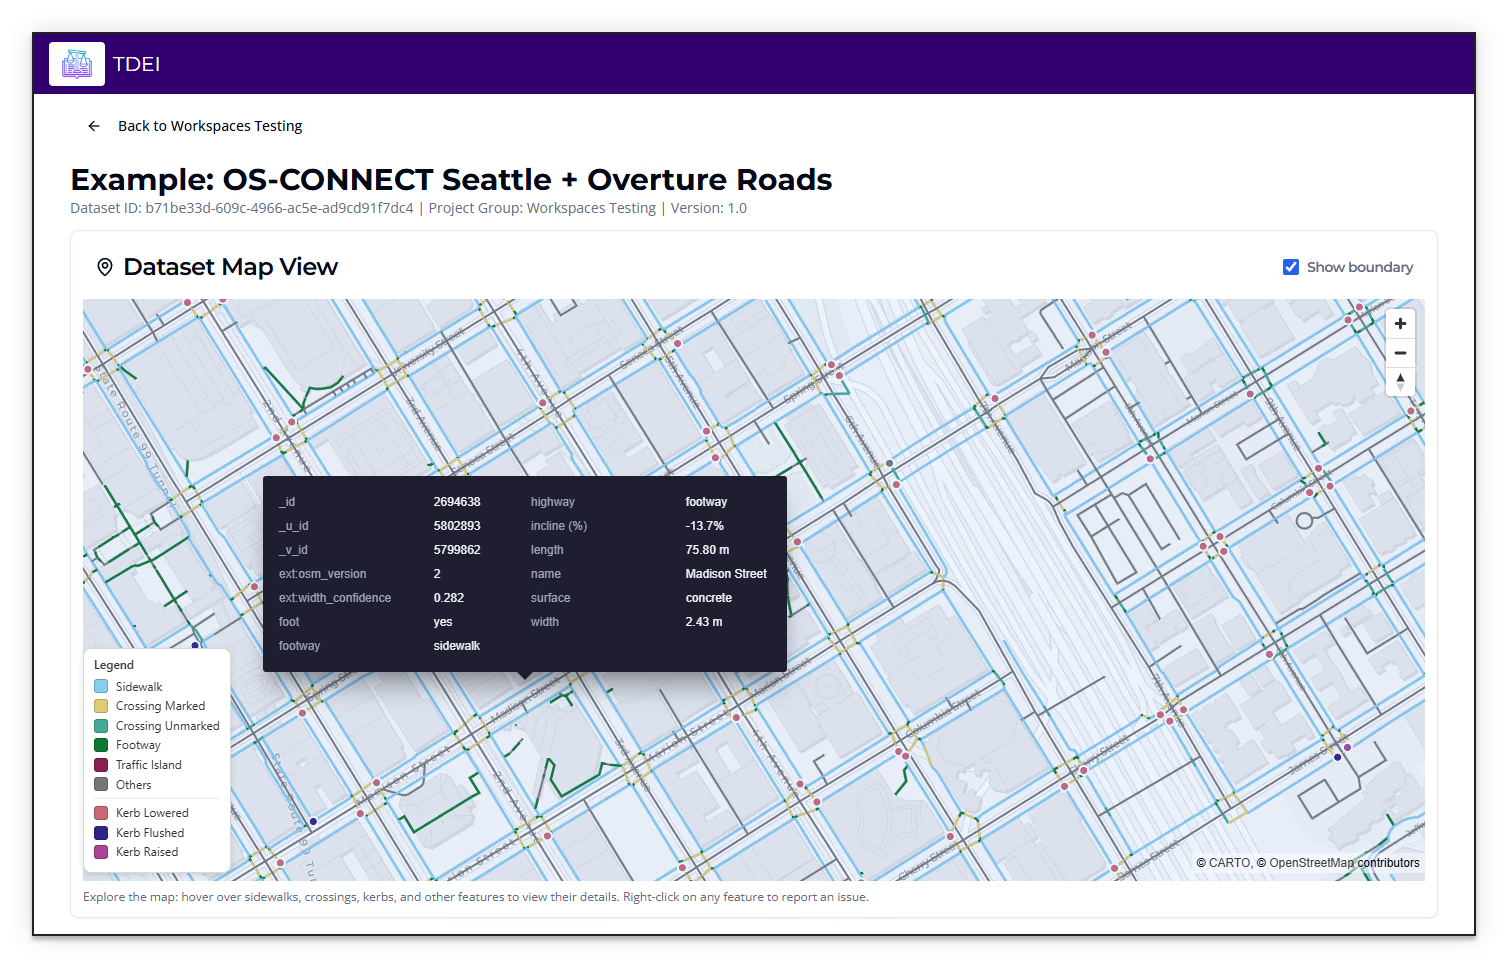
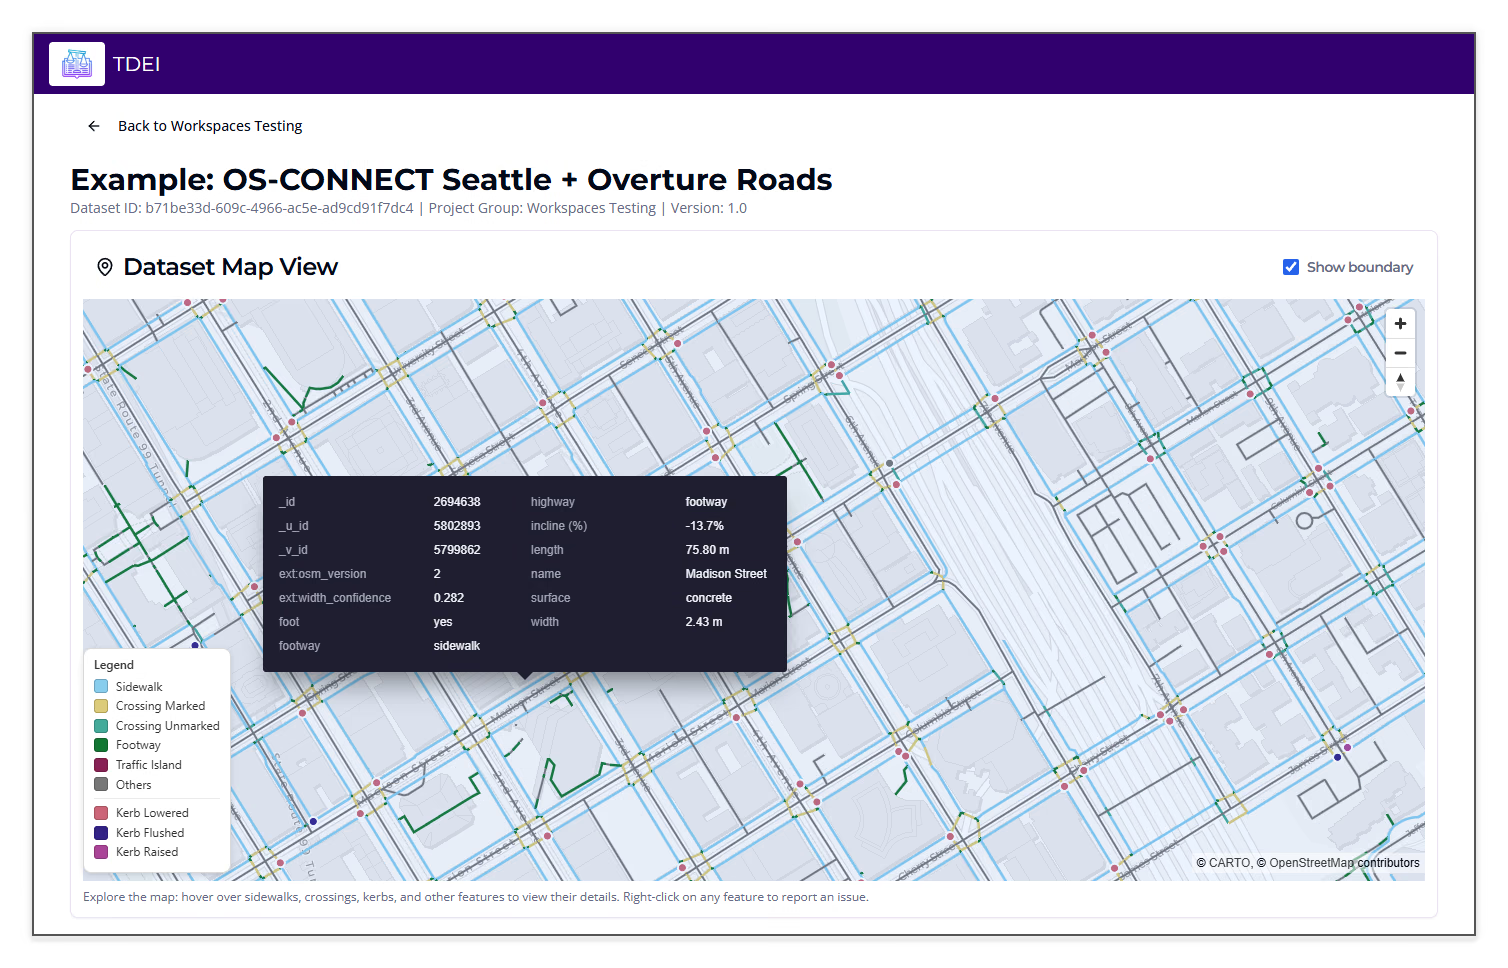
The group map attribution identifies MapLibre, CARTO, and OpenStreetMap contributors. The dataset map attribution identifies CARTO and OpenStreetMap contributors.
Previous: Project Groups and Datasets | Next: Feature Inspection and Feedback